
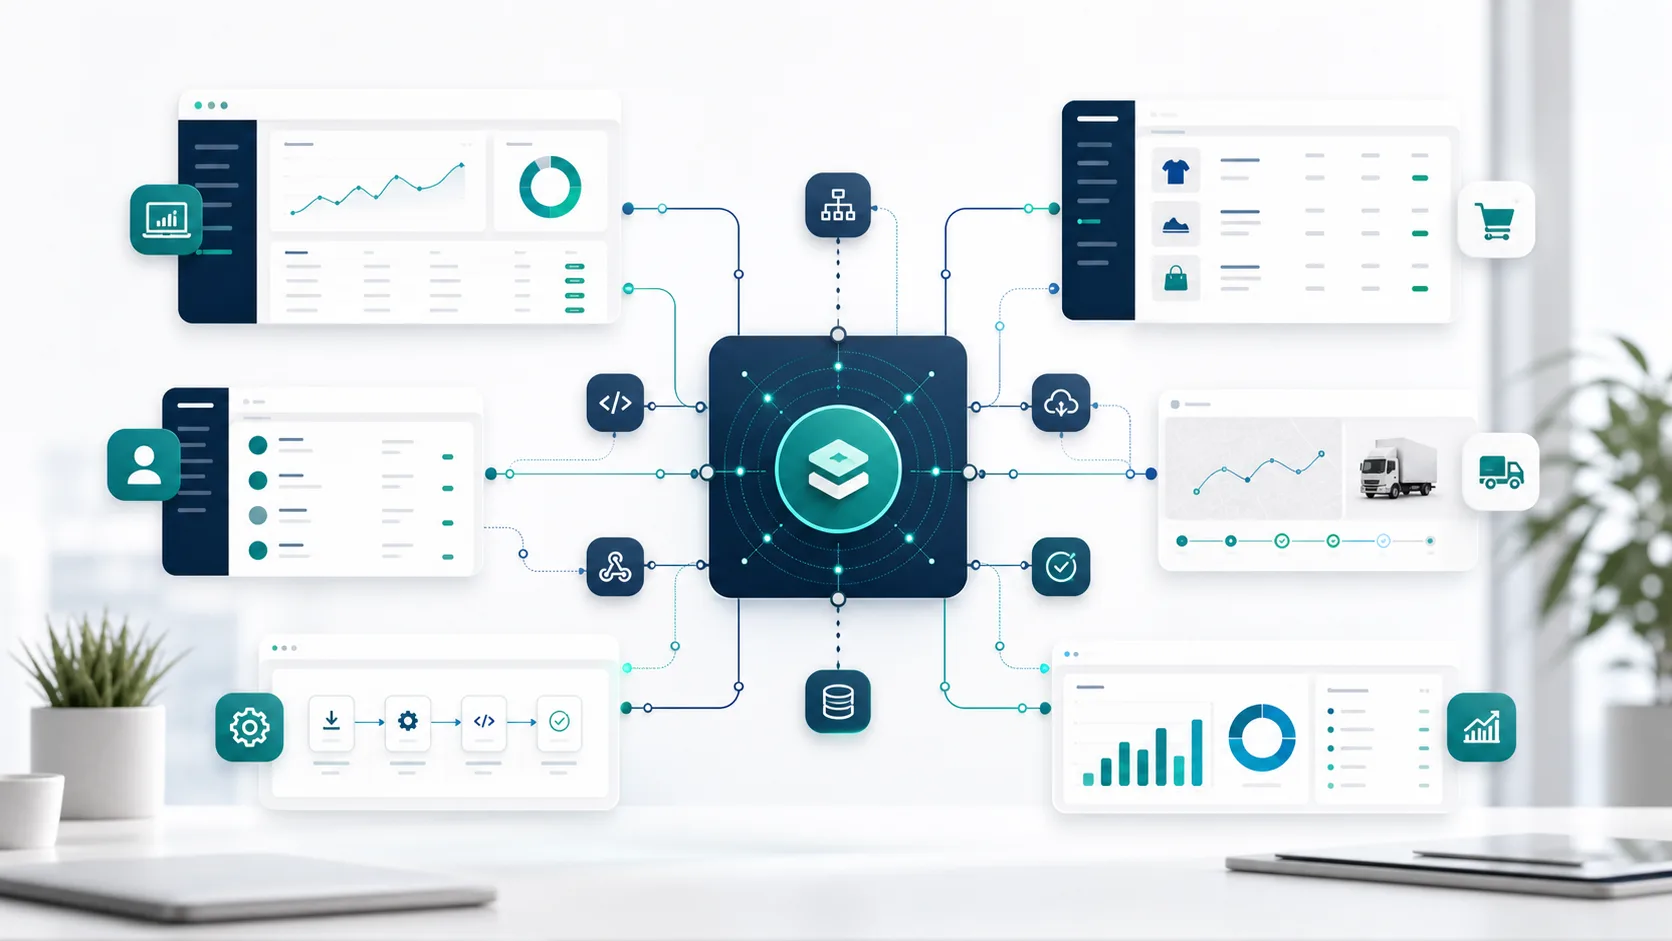
A dashboard creates value when it answers real questions: what sells, where margins are lost, which processes are delayed, which customers need attention or which channels grow profitably.
A good dashboard does not show more data: it helps teams decide sooner, with less debate and more context.
Reporting can be a very useful layer, but it needs consistent data. If ERP, ecommerce and internal tools do not share definitions, reporting becomes a debate about numbers. The first job is agreeing on what each metric means.
Fewer charts, better questions
Before designing a dashboard, list decisions. What does sales need to know every week? Which alert should operations see every morning? Which indicator reveals a margin problem? Which data does leadership need to prioritize investment?
This approach avoids dashboards that look good but do not change behavior. A useful report has few metrics, clear definitions, context and owners. If a number changes, someone should know what to review.
Preparing the data foundation
Data often comes from ERP, ecommerce, CRM, warehouse, billing and internal tools. Loads should be automated, duplicates cleaned, transformations documented and history preserved. It also helps to separate operational data from analytical data so critical systems are not overloaded.
Tools like dbt help document models and transformations. For teams getting started, the priority is not adopting a complex stack, but creating a maintainable foundation: clear sources, shared definitions and reliable refresh processes.
Reporting as a living system
A dashboard is not finished the day it is published. Products, channels, business rules and priorities change. Indicators should be reviewed and versioned like any other component of the system.
Preparing data models, automating loads and documenting metrics allows teams to make decisions with more confidence. Reporting stops being a static snapshot and becomes a daily operating tool.